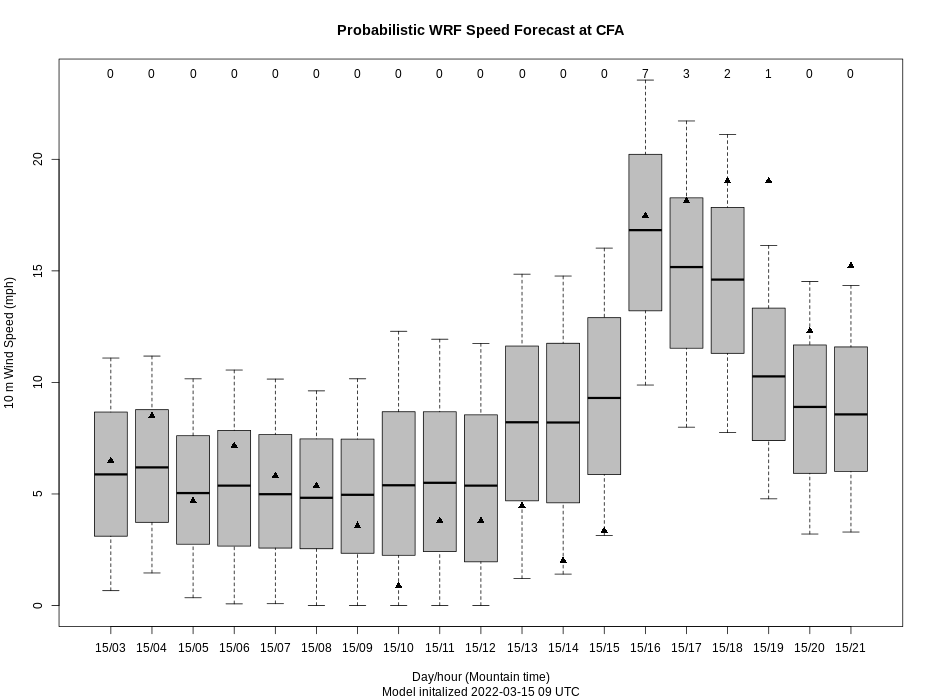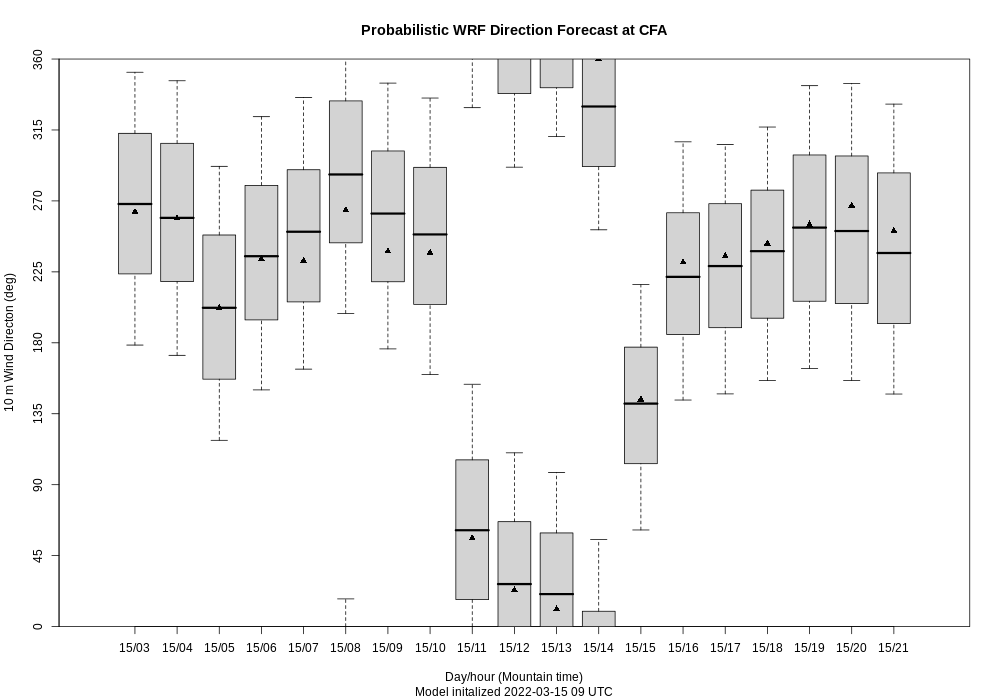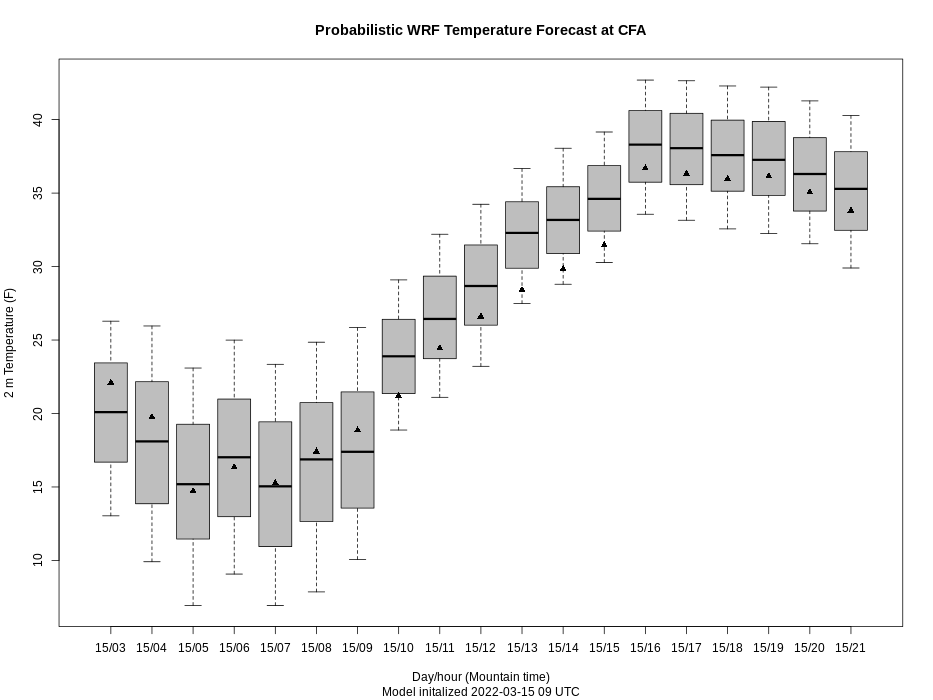
These plots show probabilistic forecasts based on Bayesian regression of the WRF output using observations from the NOAA/INL Mesonet. The regression coefficients are updated as new Mesonet data become available. In each plot the triangles are the original WRF point forecasts. The Bayesian regression algorithm generates a probability density distribution at each forecast time for the variable in question. Gray boxes show the interquartile ranges of these distributions, with the medians shown as heavy solid lines within the boxes. The whiskers show the range from the 10th to 90th percentiles of the distributions.
The plots are intended to account for both the WRF bias and random variability.