will also use newer technologies that were not available at the time of Prairie Grass. Our current tracer technology can measure both the
mean concentration and concentration fluctuations. For characterizing the state of the boundary layer we plan on using three-dimensional sonic anemometers,
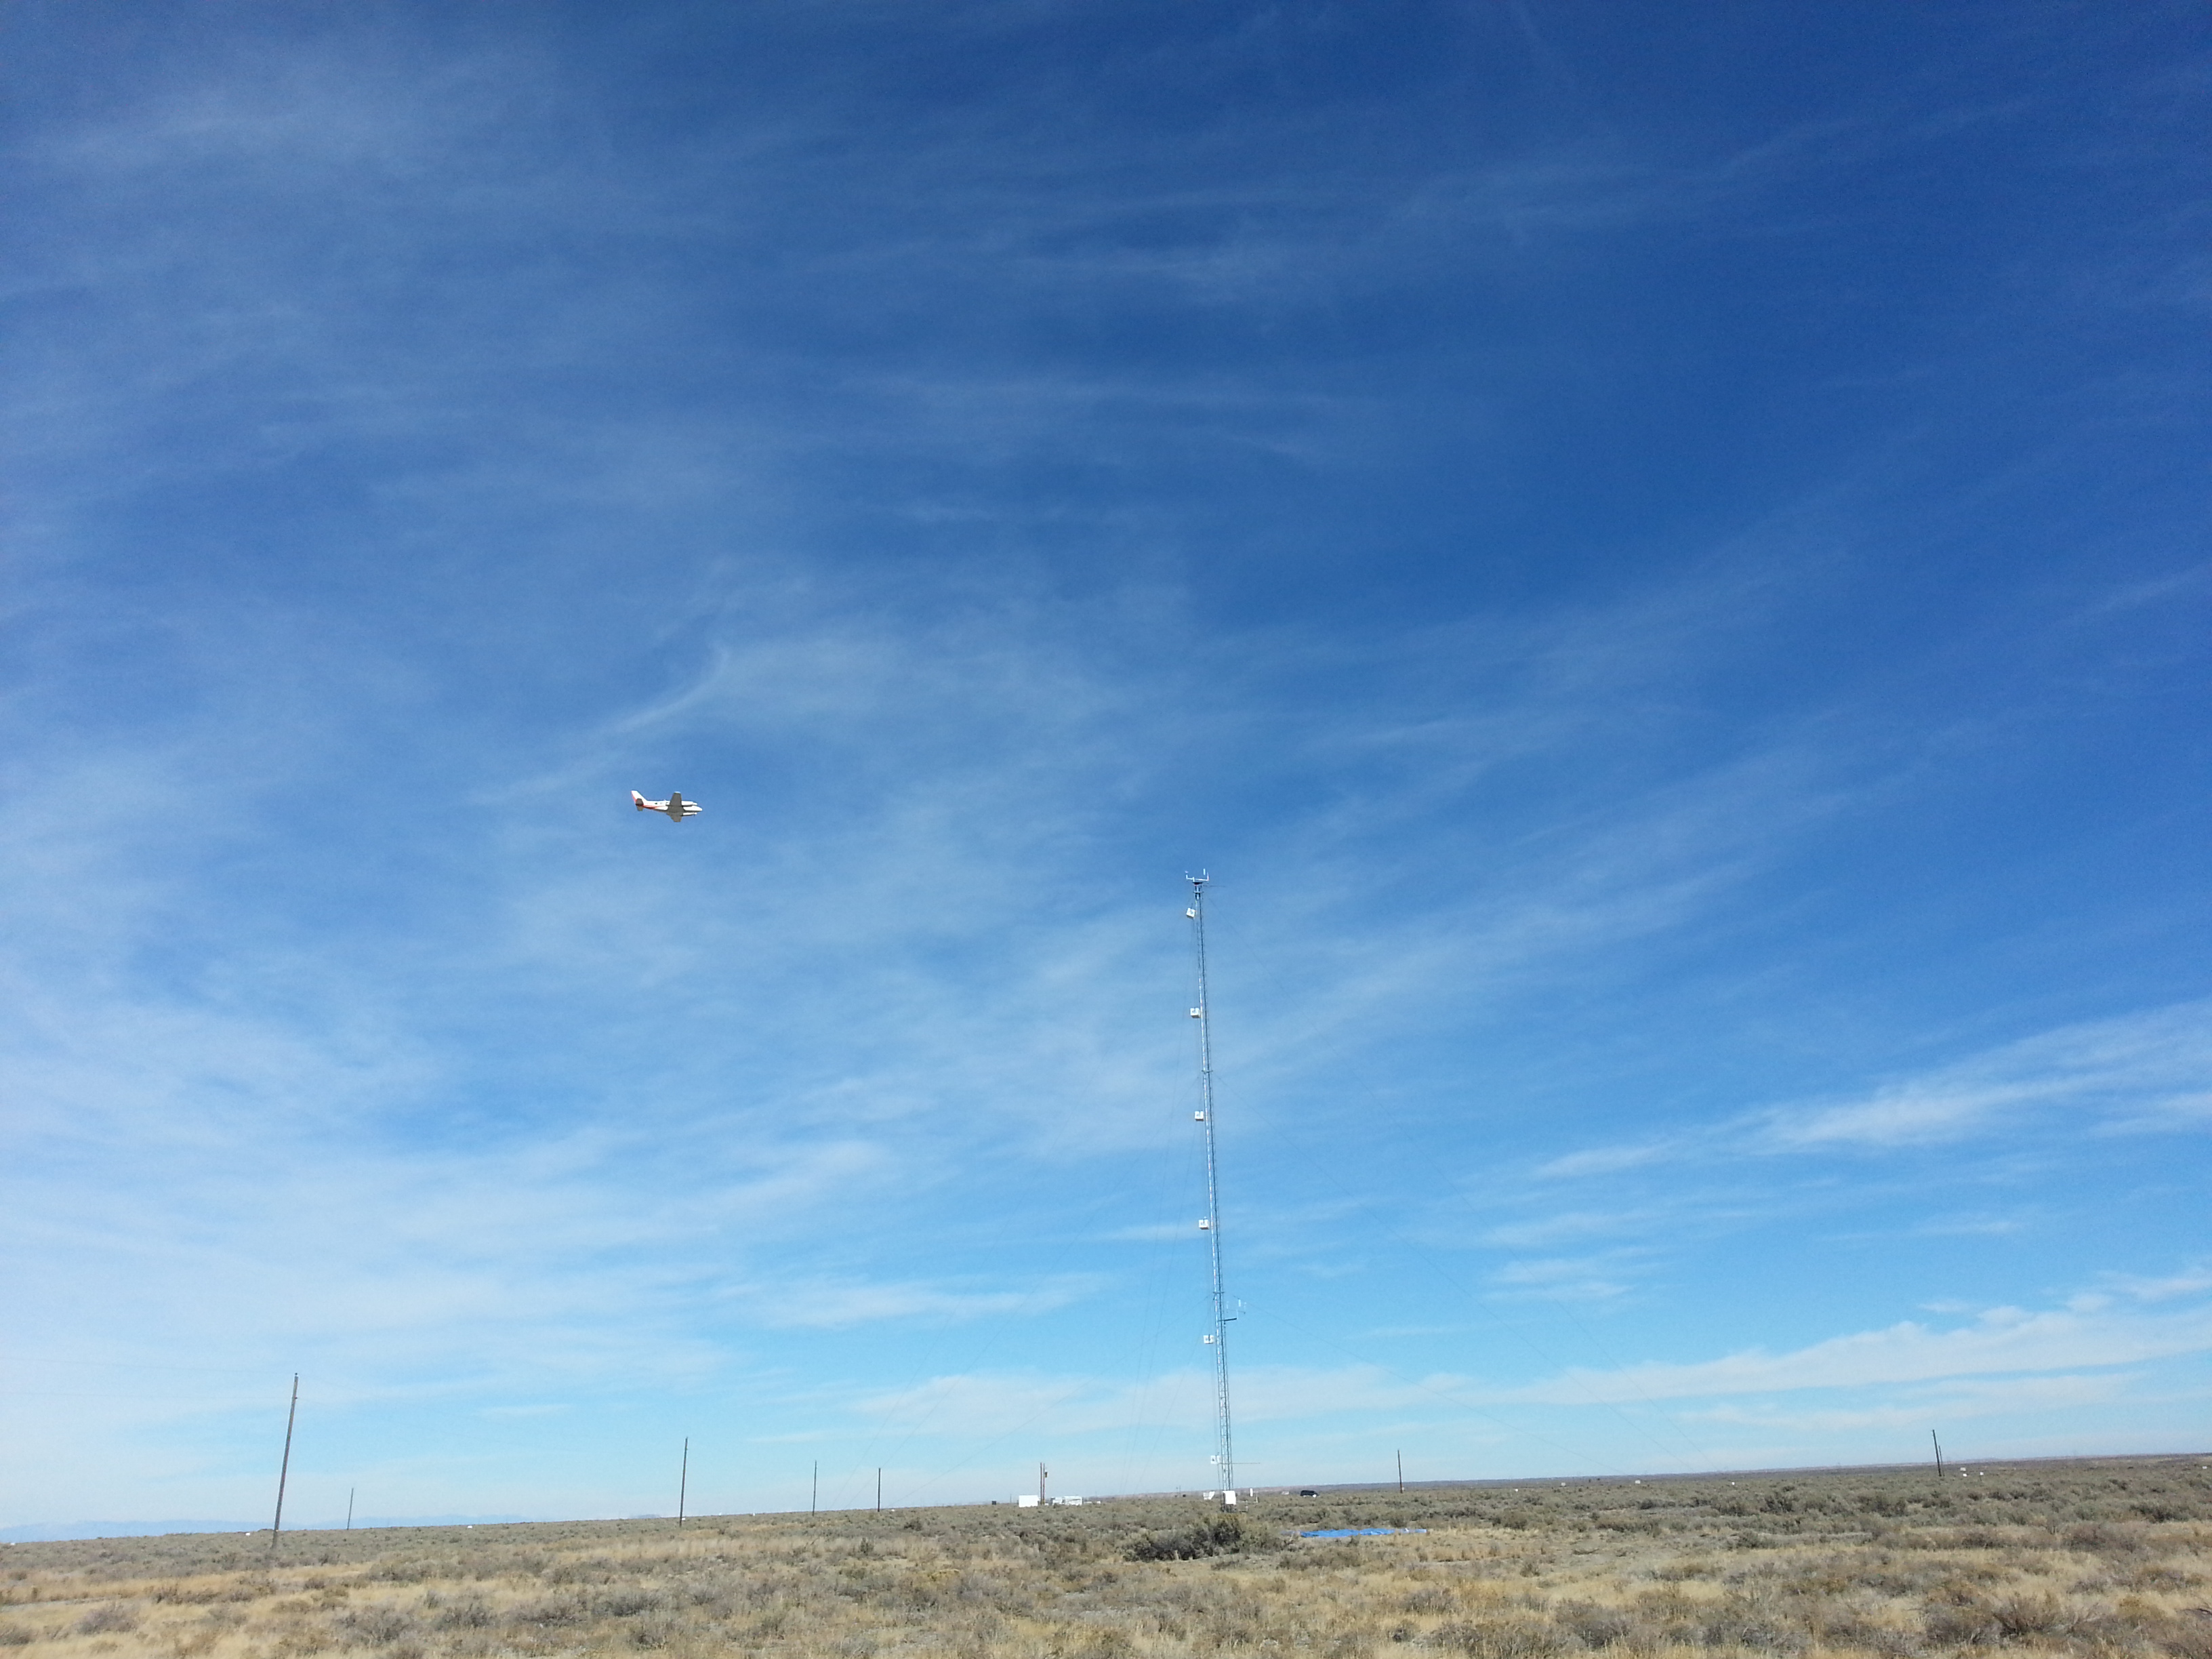
sodars, a 915 MHz radar profiler, and an existing meteorological network containing 34 towers. A 61 m tall tower in the study area will
provide the means of making detailed observations of the vertical turbulence and temperature profiles. Additional sensors may be provided by collaborators.
Objectives:
As noted in the introduction, the Sound-Barrier Tracer Study showed deviations from the Prairie Grass results in both stable and unstable
conditions. This leads to some basic questions regarding the repeatability of dispersion results from short-term
studies such as Prairie Grass, which took place over a single intensive observation period in July and August 1956. Are the observed deviations due to
different surface roughnesses at the two sites, different methods of measuring boundary-layer stability, random variability, seasonal differences, or
perhaps something else? Will further tracer releases continue to show deviations from the Prairie Grass results? As a result of the issues identified above,
the science objectives of Project Sagebrush are to:
-
Improve the understanding of short-range dispersion from continuous near-surface releases in nearly flat terrain using modern meteorological
sensors and tracer technology.
-
Improve the understanding of concentration fluctuations within continuous plumes.
-
Assess the overall repeatability and applicability of individual tracer studies by comparing the new tracer results to classical tracer
experiments.
-
Develop improved parameterizations linking plume widths to observed boundary-layer structure.
-
Develop improved dispersion models for both mean concentrations and concentration fluctuations.
-
Provide a new high-quality data set for testing and validating existing dispersion models.
The emphasis of Phase 1 was on making tracer measurements in neutral to weakly unstable conditions during the daytime hours.
The emphasis of Phase 2 was on making tracer measurements in light winds, both in very unstable conditions during the daytime and very stable conditions
at night.
Summary:
PHASE 1
Phase 1 of Project Sagebrush started the first week of October in spite of the government shutdown. The Piper Navajo aircraft from the
University of Tennessee Space Institute (UTSI) had arrived the previous week and was fitted out with a Trace Gas Analyzer (TGA) for sampling
the SF6 tracer used in the project. A shakedown flight of the aircraft was completed on 1 October. The weather during the first two weeks of
October was unfortunately rather unsettled and not ideal for the planned tracer studies. Regardless, three of the planned five Sagebrush tracer
releases were completed on 2, 5, and 7 October with the UTSI aircraft participating in all three.
After the release on the 7th, the weather turned more unsettled and looked to remain so through much of the original two-week window for Phase 1.
The UTSI staff therefore decided to return to Tennessee on the 9th. FRD extended Phase 1 for one week to conduct additional releases without the
aircraft. This entailed reducing the tracer release rate and moving some of the tracer samplers closer to the source. Two final releases were
conducted on 11 and 18 October. Overall, the one-week extension of the study allowed FRD to meet its original objective of completing five
successful tracer releases.
PHASE 2
The four summer daytime tracer experiments of Phase 2 of Project Sagebrush (PSB2) were conducted
between July 26 and August 5. These releases targeted light winds on sunny afternoons. Tracer was
released for 2.5 hours and collected in bags at 10-minute averaging intervals. The sampling was done for
a two hour period (12 bags per sampler) at four arcs located between 100 and 800 m from the source.
The three closest arcs spanned an angle of 210 degrees at 6 degree sampler spacing, whereas the 800 m arc was
narrower. A mobile tower provided vertical tracer samples up to 25 m AGL. One fast response tracer
analyzer was also deployed on each arc.
Overall, predicting the average wind direction under daytime light wind conditions proved challenging
even with the wide 210 degree sampling arcs. Even high-resolution numerical forecasts have difficulty
forecasting wind directions under these conditions. Still, three of the four daytime experiments ended up
providing useful tracer data, and even the fourth experiment may have limited periods of useful data.
The four nighttime tracer experiments of the part of Phase 2 of Project Sagebrush (PSB2) were conducted between
October 13 and October 26. These releases targeted light winds on clear nights shortly before sunrise.
Tracer was released for 2.5 hours, but the first half hour was used to allow the plume to reach all the
sampling arcs, so sampling did not take place during this time. For the remaining two hours, the
samplers were programed to collect 10-minute samples per bag (12 bags per sampler). Samplers were
deployed on three 210 degree arcs located between 100 and 400 m from the source. A mobile tower at 400 m,
a fixed tower at 200 m, and a set of three fixed towers at 100 m provided vertical tracer samples ranging
from 10 to 25 m AGL. One fast response tracer analyzer was also deployed on each arc.
Predicting the average wind direction under nighttime light wind conditions proved challenging even
with the wide 210 degree sampling arcs. Even high-resolution numerical forecasts have difficulty forecasting
wind directions under these conditions. Still, each of the four nighttime experiments had some periods
that provided useful tracer data with some much better than others.
Data:
Data is available upon request.
Publications:
-
Clawson, Kirk L. , D. D. Finn and R. Eckman, 2015:Dispersion
Characteristics of Project Sagebrush Phase 1. 95th Annual American Meteorological Conference. Air Pollution
Meteorology Observational Studies. 4-8 January Phoenix, AZ Amer. Meteor. Soc., 1.1
-
Eckman, R. , K.L. Clawson, and D. D. Finn, 2015:Changes in
Horizontal Plume Distributions at Larger Turbulence Intensities. 95th Annual American Meteorological Conference.
Source Models and Atmospheric Dispersion Studies. 4-8 January Phoenix, AZ Amer. Meteor. Soc., 3.6
-
Finn, D., K.L. Clawson, R.M. Eckman, R.G. Carter, J.D. Rich, T.W. Strong, S.A. Beard, B.R. Reese, D. Davis, H. Liu, E. Russell, Z. Gao,
S. Brooks, 2015: Project Sagebrush Phase 1, NOAA Technical Memorandum OAR ARL-268 , Air Resources Laboratory, Idaho Falls, Idaho, pp 338.
doi:10.7289/V5VX0DHV
-
Finn, D., K .L. Clawson, R. M. Eckman, H. Liu, E. S. Russell, Z. Gao, and S. Brooks (2016): Project Sagebrush: Revisiting the Value of the Horizontal Plume Spread Parameter σy. Journal of Applied Meteorology and Climatology, 55(6): 1305-1322. doi: 10.1175/JAMC-D-15-0283.1
Finn, D., K.L. Clawson, R.M. Eckman, R.G. Carter, J.D. Rich, B.R. Reese, S.A. Beard, M. Brewer, D. Davis, D. Clinger, Z. Gao, H. Liu, 2017: Project Sagebrush Phase 2, NOAA Technical Memorandum OAR ARL-275 , Air Resources Laboratory, Idaho Falls, Idaho, pp 391. doi:10.7289/V5/TM-OAR-ARL-275.
-
Finn, D., R. Carter, R. Eckman, J. Rich, Z. Gao, and H. Liu, 2018: Plume Dispersion in Low-Wind-Speed Conditions During Project Sagebrush Phase 2, with Emphasis on Concentration Variability. Boundary-Layer Meteorology. https://doi.org/10.1007/s10546-018-0360-8.
-
Ngan, Fong, A. Stein, D. Finn, and R. Eckman, 2018: Dispersion Simulations using HYSPLIT for the Sagebrush Tracer Experiment. Atmospheric Environment, 186, 18-31. https://doi.org/10.1016/j.atmosenv.2018.05.012.
Collaborators
Contact:
Roger Carter
1750 Foote Dr.
Idaho Falls, ID 83402
(208)526-2745
email: Roger.Carter@noaa.gov
|
 |